
Reversing Bus Telemetry
Ever since I got my hands on Software Defined Radios (SDRs), I wanted to decode the signals that are used to display live information at bus stops. I tried for quite some time to find information online, but there is not much technical stuff available. Even though companies have tons of flyers showing what they can do, there’s no information about how they do it. To make things worse, there seems to be no a standard and every company comes up with their own individual and undocumented solution.
Some people in the SDR community already looked into those systems. I guess the first was Oona, who found that the displays in Helsinki are controlled via DARC. DARC is a data subcarrier on FM broadcast radio, i.e., it’s a centralized system where a local radio station is distributing the information. More recently, some guys from the Chaos Computer Club in Munich implemented DARC based on GNU Radio. They talked about their implementation, their experiments, and how DARC it is used in Munich at Easterhegg 2015.
Of course, I started by checking whether DARC is also used in Paderborn, Germany, where I currently live. I fired up gr-rds, my GNU Radio FM Radio Data System (RDS) implementation to scan through the spectrum and search for an additional data subcarrier on FM radio, but, unfortunately, I could not find one. Since I didn’t have any other information, I just started to look around.
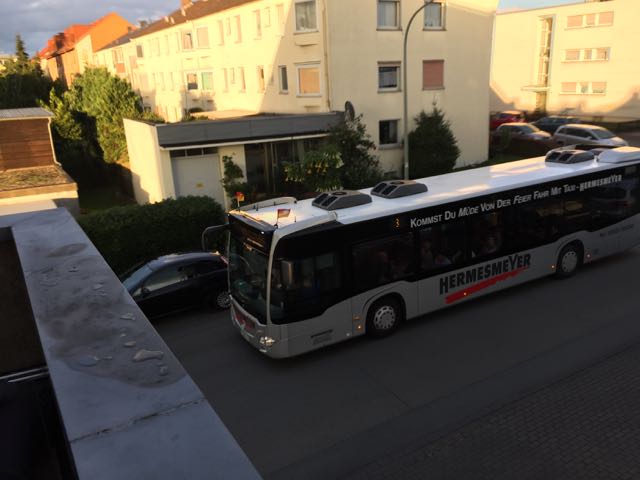
Buses in Paderborn have at least two antennas. I assume that one is for voice, while the other is for sending telemetry to the bus stops. Maybe there is also a central station that overhears all communication to provide an overview for operators. In that case DARC might be used as a complementary technology, i.e., the central station uses DARC for downlink communication to the bus stops. Then bus stops that are not directly reachable by a bus could also be informed.
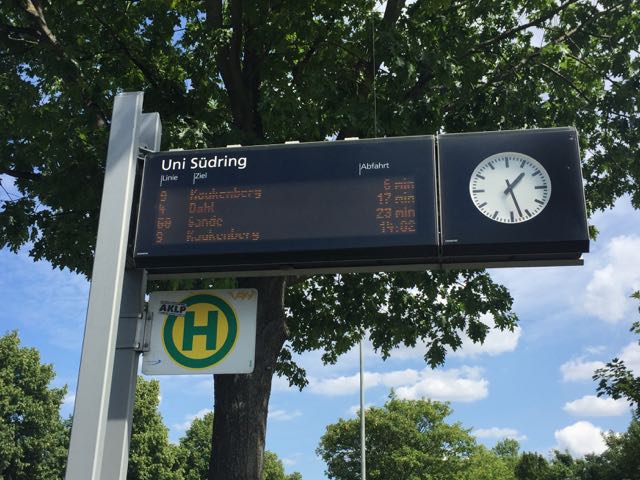
Like many other cities we have signs from Siemens at the bus stops. Since these signs are so ubiquitous, I think that Siemens just sells the displays and every city equips them with there own radio modules.
Frequency
Speaking about the radio modules, I hoped that they are not using GSM or TETRA, since these systems offer decent encryption out of the box and there is really no reason not to use it. My favorite technology was some kind of digital professional mobile radio (Betriebsfunk), which is mostly used on four bands in Germany
- 8 meters: 34.75 - 34.95 MHz
- 4 meters: 68.00 - 87.50 MHz
- 2 meters: 146 - 174 MHz
- 0.7 meters: 440 - 470 MHz
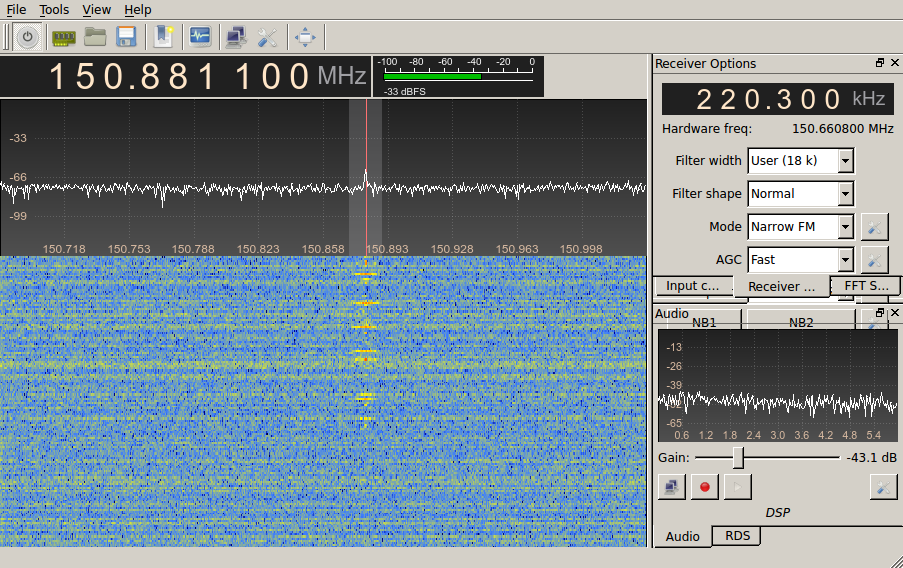
I used a gr-fosphor as a spectrum analyser to scan the 2 meters and 70 centimeters band and observed a very strong signal on 2 meters when a bus drove by my flat. The first time it was just line over the whole spectrum, indicating that the ADC was totally overdriven. After adjusting the gain and waiting for the next bus, it was clear that the use a frequency of about 150.9MHz.
Modulation
Knowing the frequency, I switched to GQRX to easily filter, demodulate and record the signal. Since usually FM is used on those band I tried this demodulator first. I used a bandwidth of about 18kHz.
GQRX provides two methods to export the demodulated signal; it can be recorded as a WAV file or streamed via UDP. UDP streaming is great if you are building a live receiver, but for a first look I recorded a WAV file, to study the signal offline.
There are two pretty nice applications to analyse the recorded data. I usually use the audio tool Audacity, which is great if you are mainly interested in the time domain representation. Since the signal looked quite good in Audacity, the FM demodulator seemed to be the right choice.

Bits are encoded by either the presence or absence of a half sine wave. As it can be seen in the figure, the pulse is inverted every time a pulse is present. That means that it is, unfortunately, not a carrier, which is turned on and off for a half period. This can, for example, be seen in the above signal after about two thirds. The low pulse is followed by zero and an upper pulse. If it would be a continuous carrier, the second pulse would also be low.
Bit rate
Knowing the encoding of the data, the last parameter we are missing is the bit rate. To also show the second tool that can be used to analyze the recorded data I used Baudline to determine the bit rate. Baudline is the only tool that is not Open Source, but, at least, it’s free to use.
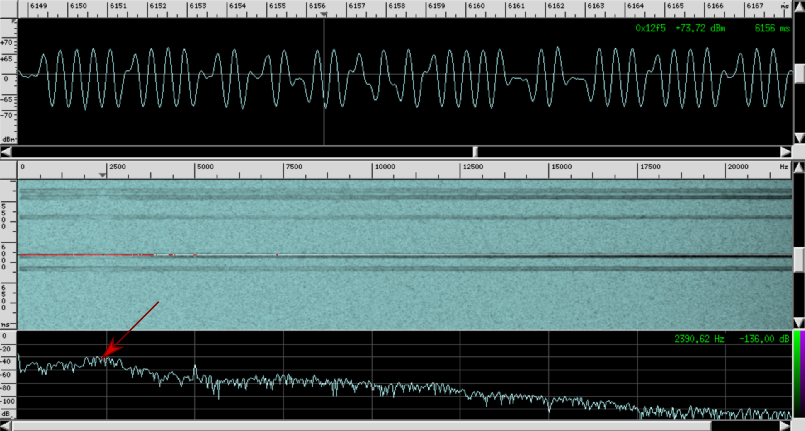
Since it is designed as a signal analyzer (and not an audio recording tool) it comes with more features and visualization options. The screenshot shows the signal in time (top) domain, frequency domain (bottom), and a waterfall plot (center). In frequency domain, we see that the spectrum has some peek at around 2400Hz. Since a half pulse is used to encode a bit, this corresponds to half the bit rate, which is therefore 4800Hz.
Decoding
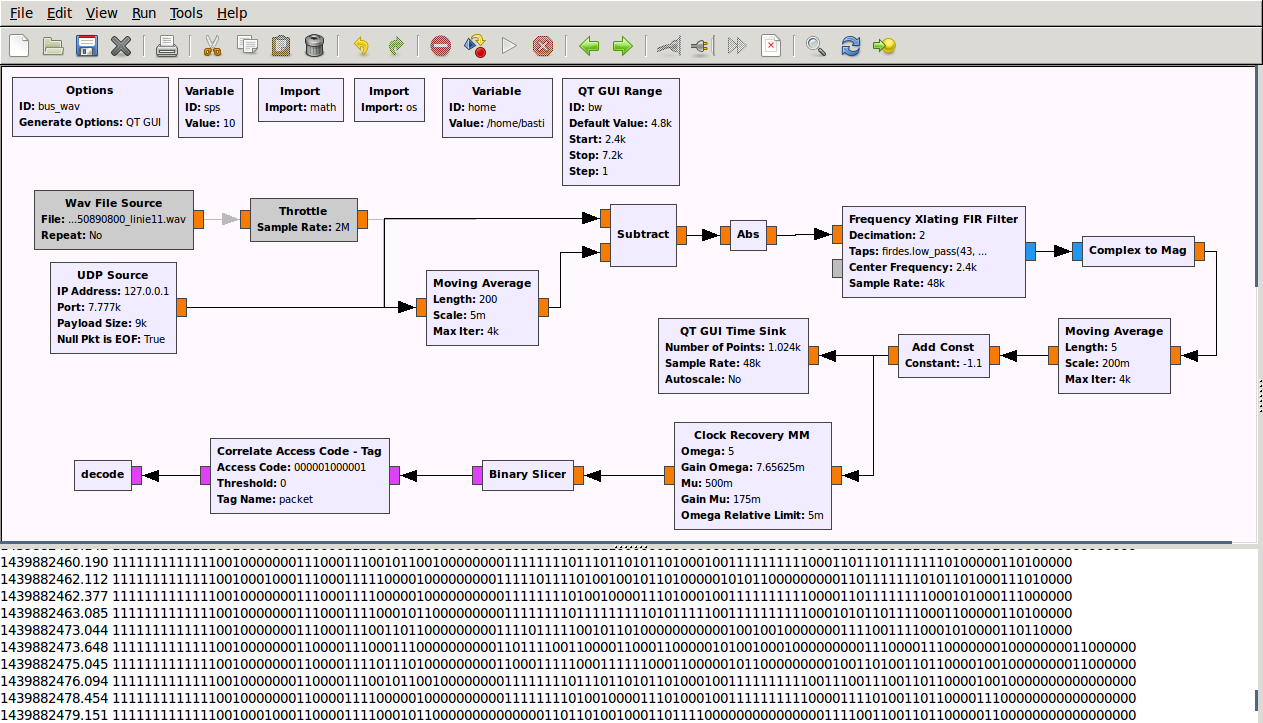
Time to start building a receiver in GNU Radio. It’s by far not ideal, but for know it does its job. It reads data from a WAV file or from a UDP socket. The UDP socket can be used to receive live data from GQRX.
However, getting the data from GQRX to GNU Radio is a bit tricky since the data format has to be converted. This can be done with a script like this.
#!/bin/bash

nc -l -u -p 7355 | \
    sox -t raw -esigned-integer -b 16 -r 48000 - \
        -efloat -b 32 -r 48000 -t raw - | \
     nc -u localhost 7777
It connects to GQRX, which by default streams to port 7355 and pipes the samples to sox, which converts 16 bit fixed-point integers to 32 bit floats and puts the samples in another UDP socket, which is read by the UDP source of our GNU Radio flow graph. With this trick we can use the very same flow graph for offline processing of WAV files or as a live receiver by connecting it to GQRX. The rest of the flow graph is basically centering the signal around zero, filtering, resampling, and decoding of the bits with the MM clock recovery block.
Frame Detection
The clock recovery block outputs an endless stream of symbols even when running on noise. Therefore, the next step is to search for a frame based on a common starting sequence. With Audacity and some pen-and-paper work I easily found a common pattern at the start of every frame. I used this start of frame delimiter to parameterized the Correlate Access Code block. This block adds a tag whenever it finds the sequence in the sample stream.
At this point I started a block that should later parse the received frames. In its initial version, it just searched for the frame start tag and printed a fixed number of ones and zeros.
The next days were all about staring at this sequences of ones and zeros…
Bit Stuffing
The first thing I noticed is a pattern that occurred in every line after about 80 to 120 bits. The pattern contains a run of six ones and seemed to marked the end of the frame.
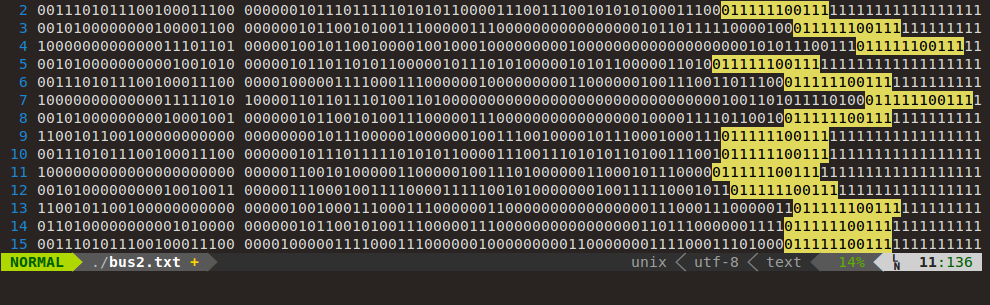
Actually, I was expecting that the end of frame markers should be present at multiples of eight bits, but as it can be seen in the picture this was not the case. This together with the fact the end of frame contained a long run of ones, I though of bit stuffing. It turns out that after a run of five ones a zero is added, except for the end of frame delimiter. Extending the decoder block to remove the stuffed bits, the end of frame markers were present at multiples of eight bits.
Error Detection
Knowing the end of frame delimiter allows us to work on complete frames as opposed to bit sequences of unknown length. The next step is to search for patterns in the payload. It was soon pretty obvious that the data had a clear structure, indicating that no encryption was used. The sole exception from the regular structure were the last 16 bits, which seems to be totally random. Random looking bits at the end of the frame are, of course, a clear indicator for some kind of error checking sequence. Looking a bit closer, I found frames that differed only in a single bit, but had completely different error checking sequences. This destroyed my initial hope that it’s generated simply by xor’ing bytes.
Looks like a Cyclic Redundancy Check (CRC) is used and we have to search for a polynomial that produces the sequence. Fortunately, there is CRCReveng, an Open Source application, which does just that. Now, there is one problem left: Since we don’t have error checking yet, there might be frames with errors that confuse CRCReveng. Therefore, I took 13 frames and created a python script that calls CRCReveng with subsets of these frames, starting with larger subsets first. This generated a huge output file containing the following lines.
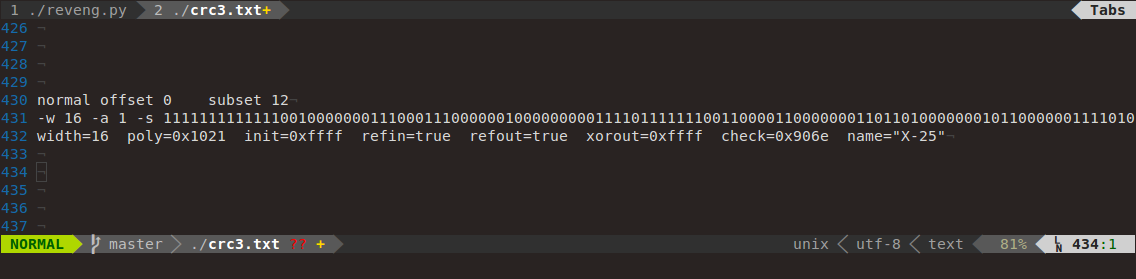
It shows that 12 of 13 CRCs can be generated with the polynomial 0x1021, which further tests proved to be the correct one. Interestingly, CRCReveng knows this polynomial from X-25. I had a quick look at X-25 and AX-25 and it seems that the system is heavily inspired by those standards. Also the start of frame and end of frame sequences match with the ones from X-25.
Making sense of some bits
The rest was all about staring at bits, guessing, trying, parsing and visualizing. I found things like
- bus ID
- line
- bus stop
- distance from last bus stop
- delay
… and many, many more.
Fortunately, there is also position information available and even the orientation of the bus is encoded with three bits (north, north-east, east, …).
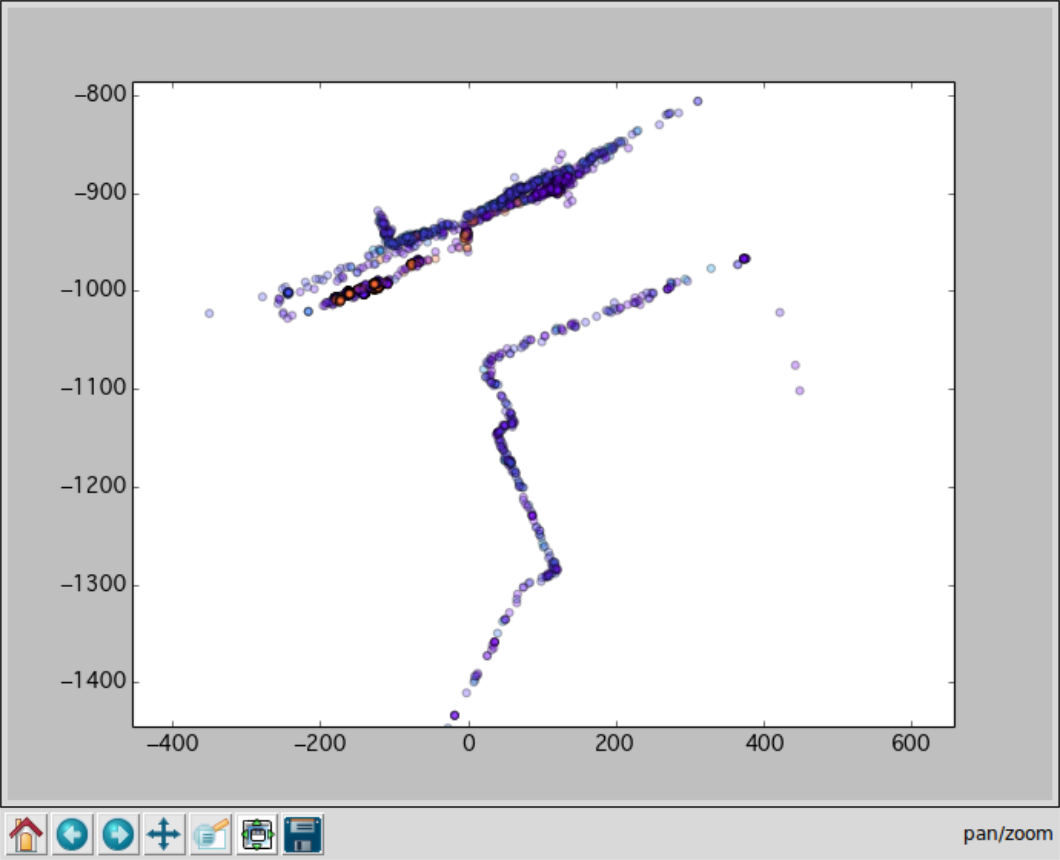
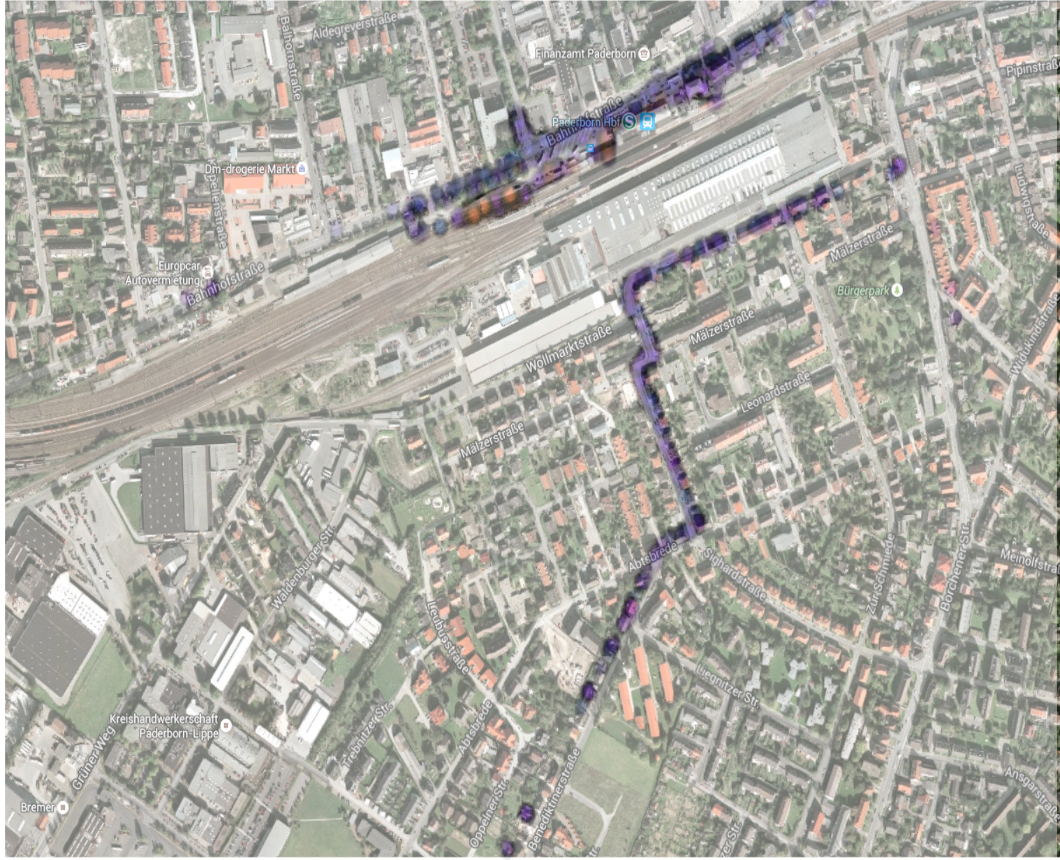
Visualization
Finally, I created a small web-based GUI. The backend is based on NodeJS, which reads the logs of the receiver and pushes the binary string to the frontend. The frontend uses Leaflet for the map and some custom javascript code to parse the data and plot the buses.