
Spectrum Scanning with WiFi Cards
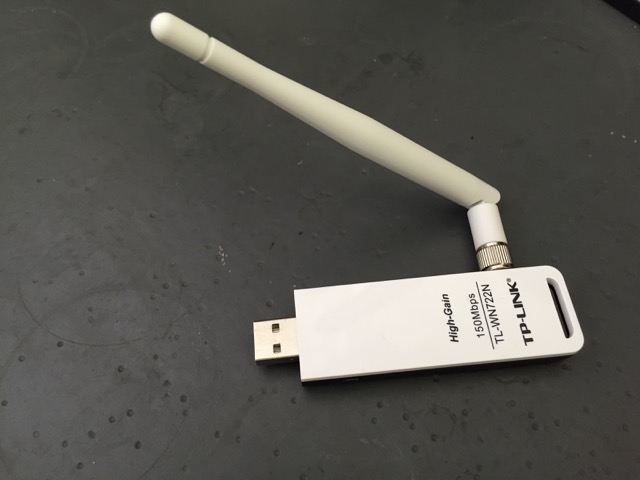
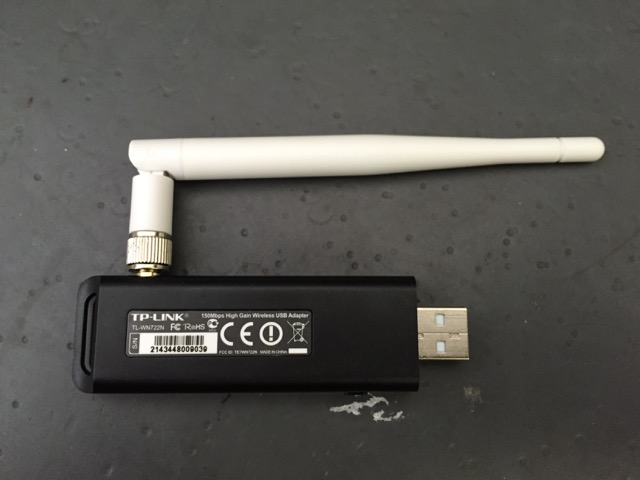
I’ve heard that some Atheros WiFi cards support spectral measurements—particularly the ones using the Linux ath9k driver. In our lab at UCLA we have USB dongles that use the ath9k_htc driver and wanted to give it a try.
As it turns out the ath9k_htc driver uses some code from ath9k but is actually a different driver. Fortunately, also the ath9k_htc got patched to support spectrum scanning in November 2014. This patch is part of Linux starting from version 4.3-rc4.
An up-to-date kernel will show the interface to configure spectral scanning in debugfs.
root@virt:/sys/kernel/debug/ieee80211/phy0/ath9k_htc# ls
base_eeprom   queue   spectral_count       spectral_scan_ctl      tgt_tx_stats
debug         recv    spectral_fft_period  spectral_short_repeat  xmit
modal_eeprom  skb_rx  spectral_period      tgt_int_stats
phy_err       slot    spectral_scan0       tgt_rx_stats
To me it looks like the spectrum scanning functionality was reverse enigneered, i.e., the driver can perform measurements, but there is no official documentation about the data format and how to interpret the measurements.
Some information about the interface and the data format is available on the Linux Wireless Wiki and on blog posts, e.g., here and there.
When implementing my measurements script I looked at the two projects referenced in the Wiki. One project is by Lorenzo Bianconi, while the another project is by Simon Wunderlich. Both projects agree in how the power should be calculated, but they differ in how the individual measurements should be mapped to frequencies.
The relevant part from Bianconi:
#define SPECTRAL_HT20_NUM_BINS      56
freq = fft_data->freq - 10.0 + ((20.0 * i) / SPECTRAL_HT20_NUM_BINS);
and from Wunderlich:
#define SPECTRAL_HT20_NUM_BINS      56
freq = result->sample.ht20.freq -
    (22.0 * SPECTRAL_HT20_NUM_BINS / 64.0) / 2 +
    (22.0 * (i + 0.5) / 64.0);
Both don’t make much sense to me since I think Atheros uses functionality that the chip already provides. When using 802.11a or 802.11g the 20MHz spectrum is divided into 64 orthogonal subcarriers with a 64 point FFT. I would expect that the measurements correspond to bins of said FFT and, thus, should be mapped to subcarrier frequencies.
54 (48 data + four pilots) of the 64 subcarriers are actually used. The rest are DC and nine guards. Currently, I assume that the measurements correspond to the utilized subcarriers plus the inner most guard carriers, i.e. carriers -28,..,-1 and 1,..,28. Consequently, my mapping looks like this
if i < 28:
    freq = center_freq - (20.0 / 64) * (28 - i)
else:
    freq = center_freq + (20.0 / 64) * (i - 27)
As a proof-of-concept I implemented a python script that plots the spectral measurements using matplotlib. It’s available as a gist. It logs in on a remote host, performs the measurement, downloads the data, outputs the raw measurements in CSV format, and plots min (blue), max (green), and average (red) power levels.
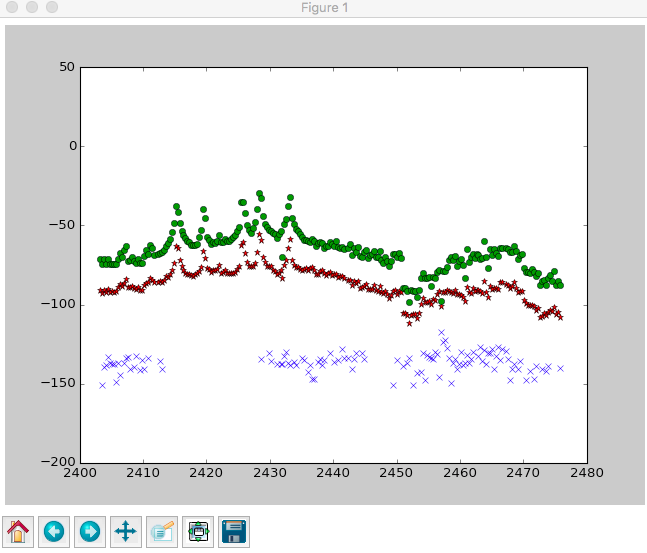
The screenshot shows some bluetooth transmissions on the lower part of the spectrum (the spikes) and WiFi on the upper part. Everything on top of a lot of WiFi background noise.
I made a small video to show how it looks like. Sometimes parts of the specturm are not measured. This might be a bug in the driver or in my code; I should have a more detailed look somewhen.