
SpectroPhone
I always wanted to try some alternative approaches to make the spectrum visible and audible. In the last days, I was playing a bit around; not with the whole spectrum, but, at least, with WiFi channel 1.
SpectroPhone -- Channel 1 in C Major
What happens here?
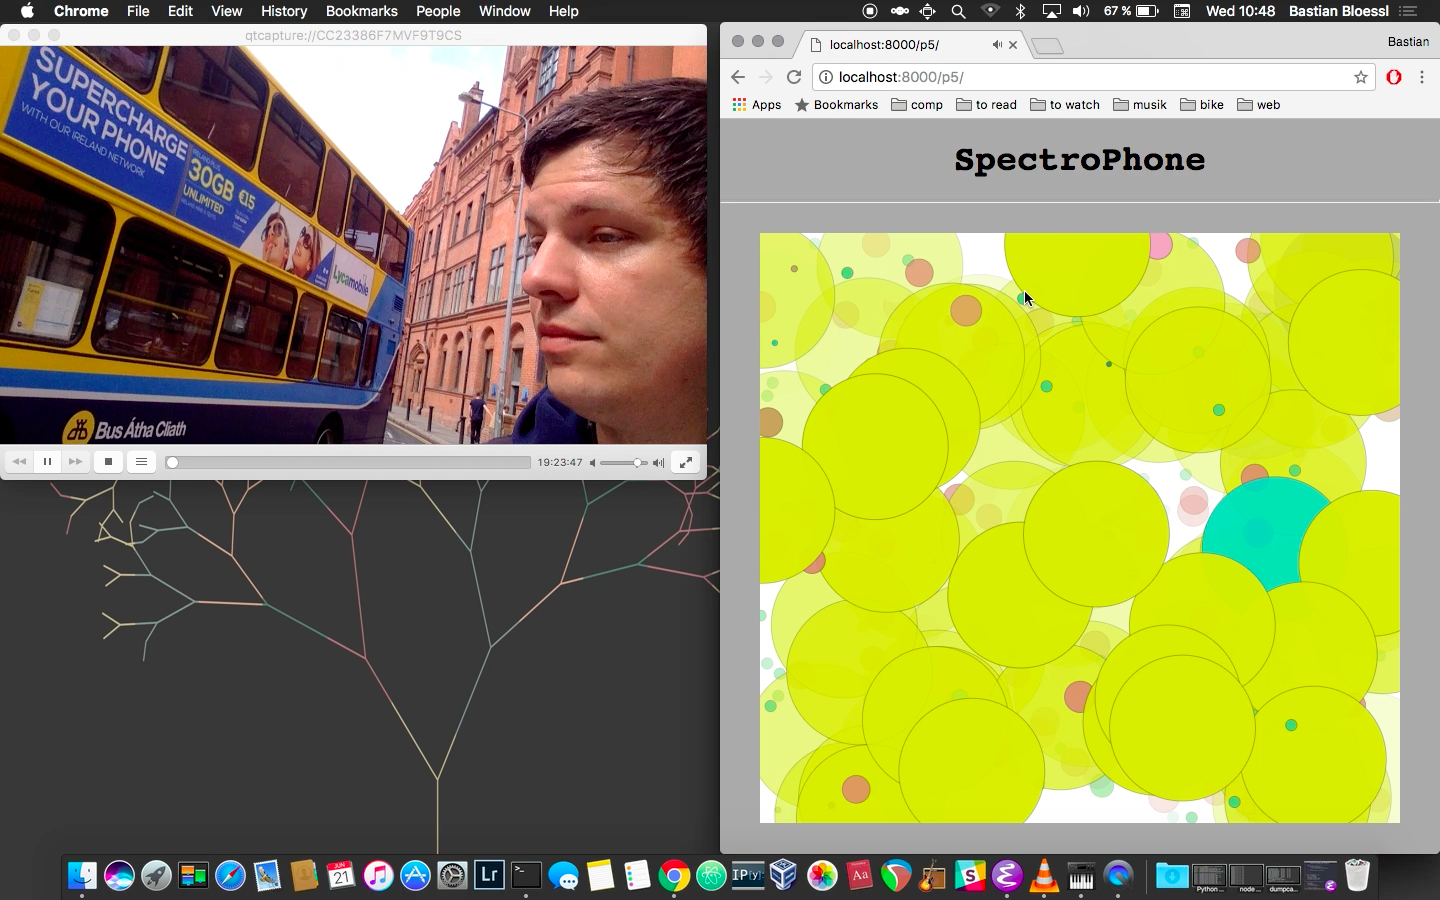
The canvas on the right is a live representation of the WiFi traffic on channel 1. Of course, I cannot see the content of the (mostly) encrypted signals. But I can record the signal strength, the size, and the hardware address of the sender.
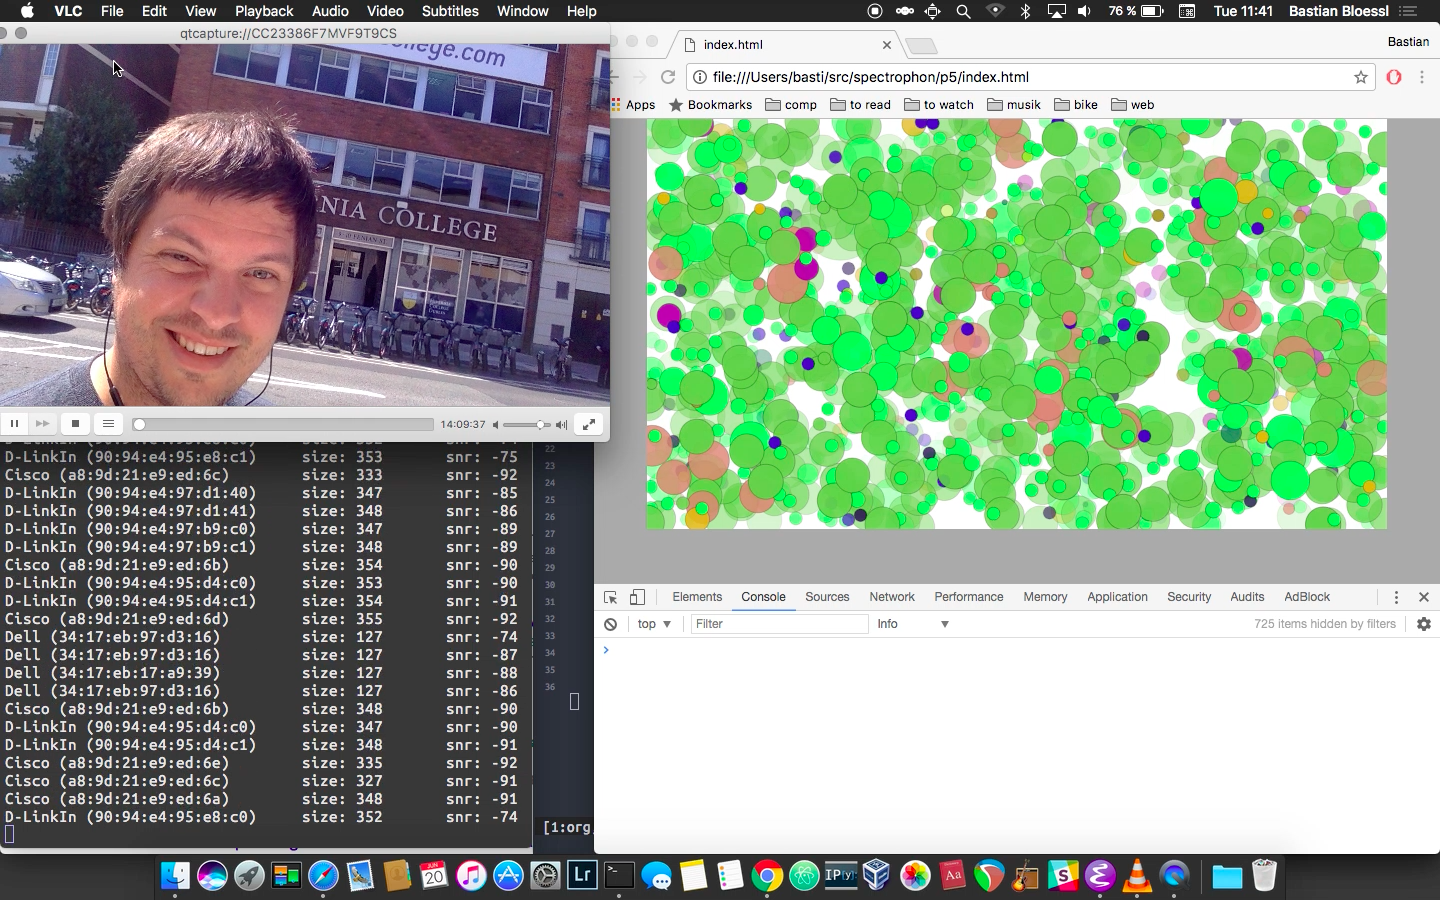
The hardware addresses are not assigned randomly. Each manufacturer gets a certain range allocated by IEEE. A list of these address ranges is available on their website.
With this list, I can map each WiFi signal to the manufacturer of the chip that sent it.
What can I see?
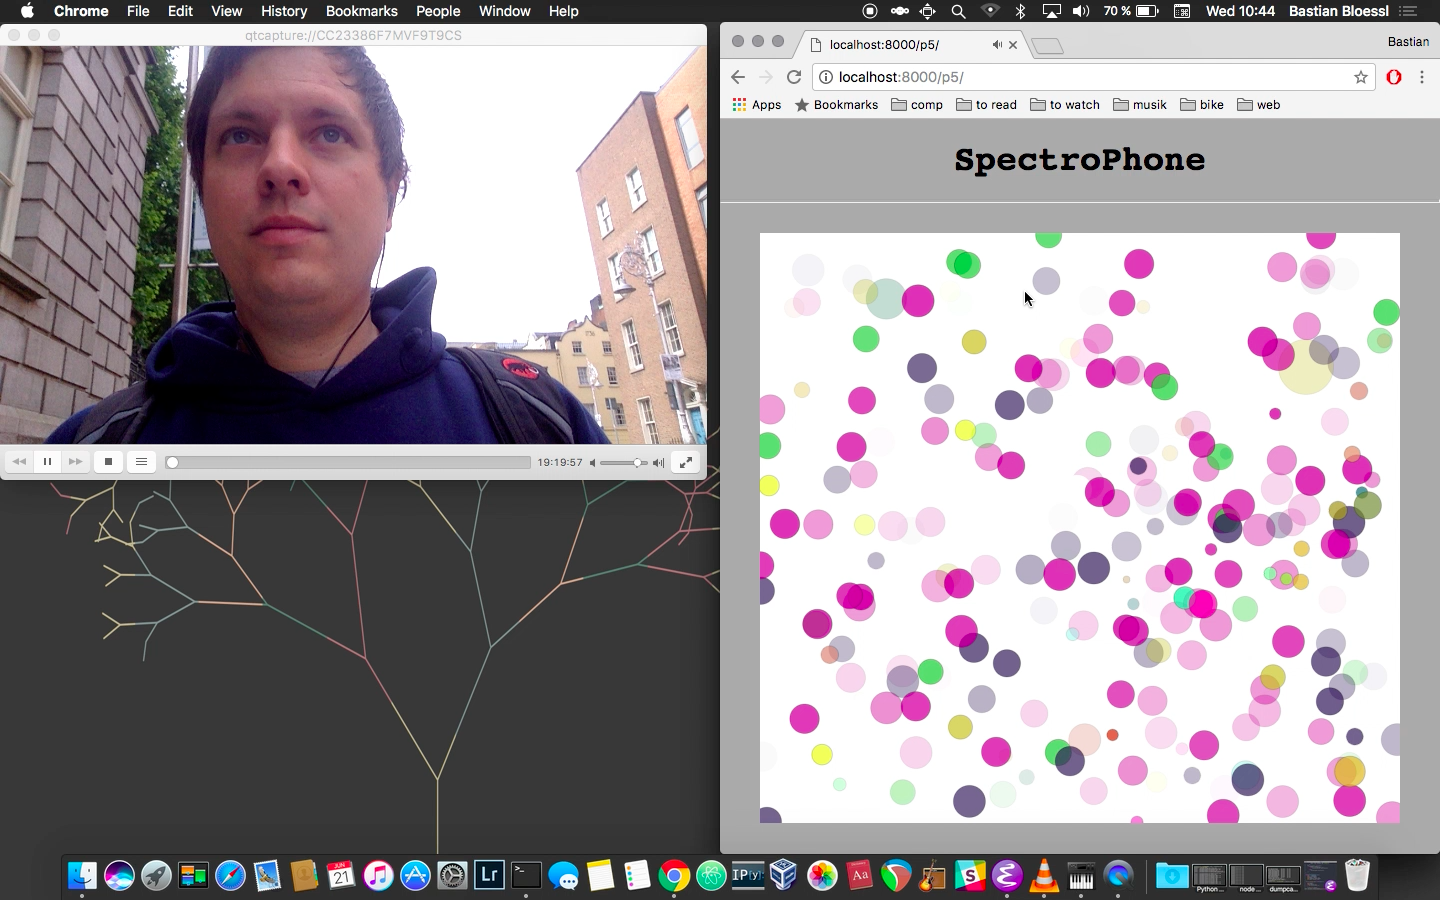
For each signal that I overhear, I place a circle randomly on the canvas. I use the following mapping to represent the WiFi traffic:
- Color: manufacturer
- Radius: amount of data
- Fade duration: signal strength
Radius and fade duration are straight forward. To map the manufacturer, I hashed the name to an RGB color. (That’s the same thing as picking a random color for the first signal and sticking to the choice for the following.) I took some screenshots in different environments.
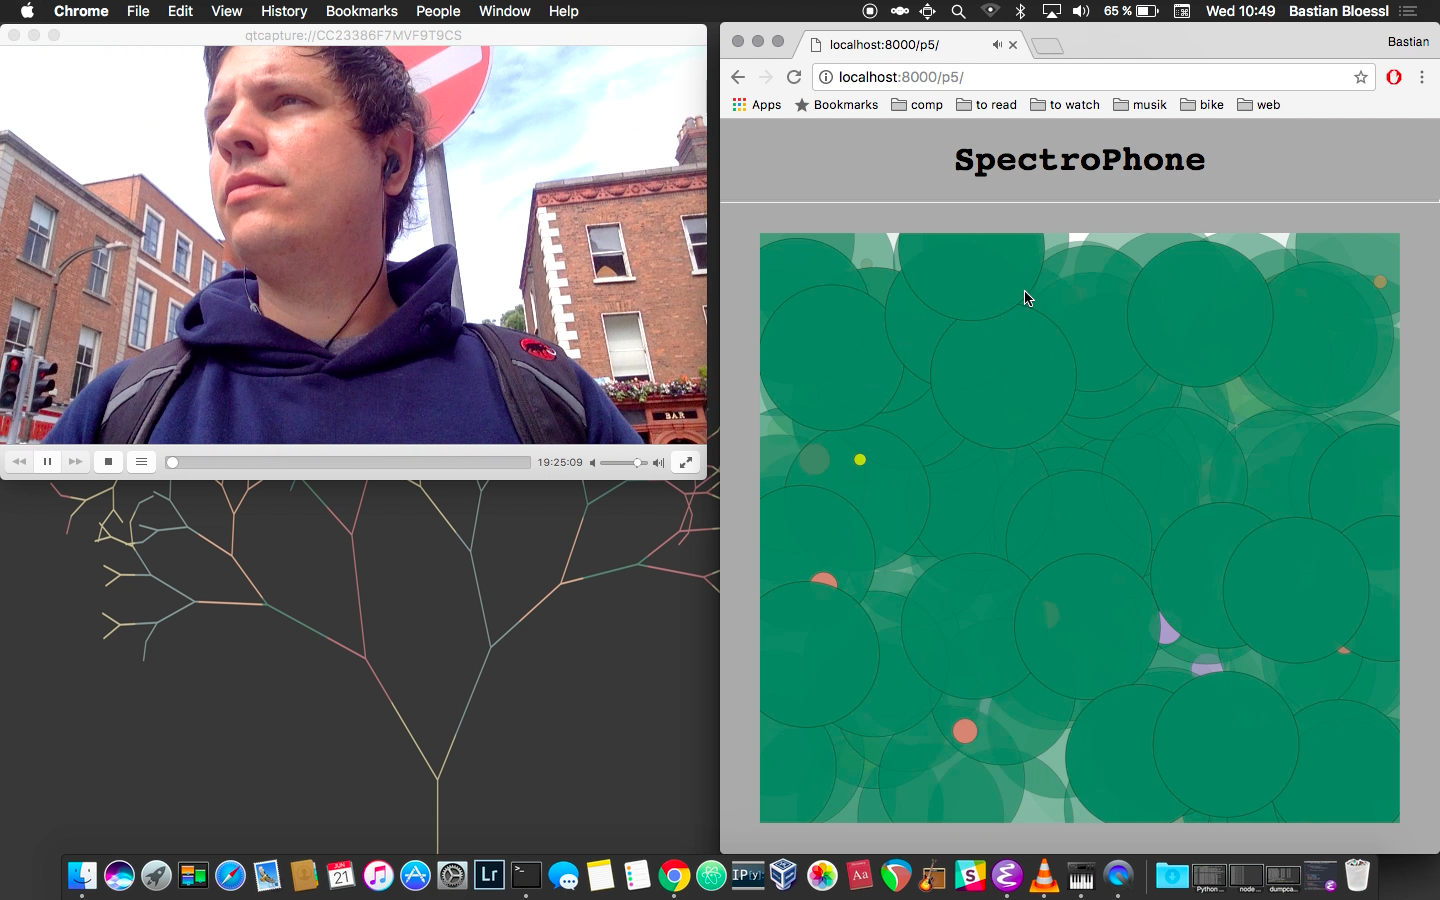
Left: Dublin’s buses use Realtek chips (yellow). Right: Apple is green. Here, my mobile phone was uploading something when I came in range of the university network.
Left: The “green college” uses infrastructure from Dell and D-Link, which were (by chance) both mapped to greenish colors. Right: The “pink streets” around the parliament.
Overall, the number and the size of frames indicate spectrum utilization, while the colors show the diversity of the hardware.
What can I hear?
To create an audio representation of the WiFi spectrum, I hash each manufacturer to a note in the c major scale. The WiFi signals then play the note. That means each WiFi signal increases the volume of the note proportional to the amount of data that it transmits. After that, the volume decays exponentially.
If there many signals from a manufacturer, the note will stay active as each signal pushes the volume up. If there are no signals, the volume goes down.
In the video, you might have noticed a constant beat from the small dark green circles. They are beacons from Virgin Media routers that are deployed everywhere in my neighborhood.
Update: Wi-Field
I took another walk through the spectrum. This time I created a starfield-like animation to visualize the frames. It doesn’t always render at full frame rate. So no happy eyeballs yet :-)
In addition, I down-scaled the volume a bit. The idea was to not clip at maximum volume if there are only beacon frames. That way, actual data transmissions would increase the volume, which was not always the case before. It didn’t work too well though.
Apart from that, I found it a bit unintuitive that frames that had very similar colors could produced totally different tones. Therefore, I mapped the colors first to their hue and used the hue to map to notes on the tone scale. This is a bit like mapping the spectrum of the rainbow to the scale.